A mathematical analysis of Squid Game, game 5
A spoiler-free look at your probability of death if you were forced to play a mathematically idealized version of the game from the hit K-drama series.
October 22, 2021
If you haven’t heard of Squid Game, please contact me and perhaps I can arrange for a landscaping company to extricate you from the rock you’ve been living under. And then read this G-rated, spoiler-free rephrasing of the fifth game from Squid Game so you can understand what the rest of us are talking about (people who have seen the show, hopefully the analogy is obvious):
A teacher has students and gives each of them the same question true/false test. They’ve been assigned an order in which to take the test, and are quizzed one-by-one down this order. For each student, the teacher asks the same questions in the same order. As soon as a given student gets a question wrong, that student is considered to have failed the test; the teacher then moves on to the next student in the sequence and restarts, asking the same questions in the same order.
The students:
- Have perfect memory, and each student is tested in front of the whole class publicly, so as soon as one student gets a question right, all subsequent students get that question right.
- Have no idea about the content of the test, so each new question has an independent 50/50 chance of being answered right/wrong.
What’s the distribution of the number of students pass the test (get all questions correct)? For example, if , there’s a chance two students pass, a chance one student passes, and a chance no student passes. How does this generalize with different values of and ?
First, note that when a teacher asks a new question (one that the class hasn’t heard yet and therefore hasn’t remembered the answer to), the class will learn the answer to this question regardless of what answer the student being tested gives. If the student answers correctly, the rest of the class will memorize that answer (and the student gets to advance to the next question); but if the student answers incorrectly, the rest of the class will simply memorize the opposite choice and learns the information regardless.
With this in mind, the students earlier in the sequence can be viewed as martyrs who reveal the answers to their later classmates, giving them a greater chance at passing. The real Squid Game is a bit different, but in this scenario, students later in the sequence have an advantage because they have strictly more information about the test than those who went earlier. The first student has only a chance of passing because that student has to guess every single question correctly. In contrast, students and beyond are guaranteed to pass, because each student reveals the answer to at least one new test question, and therefore the first students are sufficient to reveal the answers to all questions.
Towards a recursive solution
To formalize some of these intuitions, define as the probability that students have yet to fail by the time the class learns the answers to the first questions. We know because none of the students have failed when the testing begins. Our goal of finding the distribution over number of passing students is equivalent to finding for because having exactly students pass the test is equivalent to students not fail by the time the answers to all questions are revealed.
Let’s try to define a recursive solution to our problem. If students have yet to fail and the class knows the answers to the first questions, the following two events occur with equal 50/50 probability when the th question is asked:
- It’s guessed correctly, so students have yet to fail.
- It’s guessed incorrectly, so students have yet to fail.
Either way, the answer to the th question will be revealed, as discussed before. This implies half of goes to and the other half goes to . The only exception to this recursion is when ; in that case, since everyone has failed and therefore no additional students can fail, all of goes to . Using our recursion, we can generate the following table for , where the arrows denote the recursive relationships that transfer probability mass.
If you ignore the denominators of the fractions, you’ll find Pascal’s triangle. In fact, what we generated is Pascal’s triangle, but divided by . This is no coincidence; it turns out that our recursion for is exactly Pascal’s identity, but halved. This leads to the powers of two in the denominators. Additionally, the th row of Pascal’s triangle sums to , but our th row is then divided by , so each row sums to 1 in our case. This makes perfect sense because each row is a probability distribution over how many students have passed the first questions, and probability distributions must add to 1.
Thanks to the fact that the th entry in the th row of Pascal’s triangle is , we can say (after some finagling the indexing) that when , and 0 otherwise. This indexing is kind of awkward and can be cleaned up once we realize that is the number of students who have yet to fail, so is the number of students who have failed. If we define as the probability students have failed by the time the class learns the answers to the first questions, our answer becomes cleaner:
- if .
- Otherwise, .
Another less symbol-heavy way of stating this result is that the number of students who fail the exam follows a binomial distribution with trials and success probability . This connection illustrates a well-known relationship between Pascal’s triangle and the binomial distribution.
Edge cases
Unfortunately when , our math breaks down a bit because we need to consider the edge case of our recursion when all students have failed. Visually, our table is taller than it is fat in these cases, and the result isn’t quite the binomial distribution. For example, if , we get:
Our results for are incorrect for . But this actually turns out to be very easy to fix; since only the leftmost column of the table is affected, and we know every row of the table sums to 1, we can fill in the leftmost entry as one minus the sum of the rest of the row. For example, .
So, to summarize our results, if we have students and an -question test:
- If :
- There’s a probability that exactly students fail the test, for . There’s a zero probability that more than students to fail.
- The th student passes the test if fewer than students fail the test. The probability the th student passes is therefore if ; otherwise, so the student is late enough in the sequence to be guaranteed to pass.
- Else (which implies ):
- There’s a probability that exactly students fail the test, for .
- Theres a probability that all students fail the test.
Plots and stuff
We already have our results in symbolic form above, but below are a few visualizations to present the results in another angle.
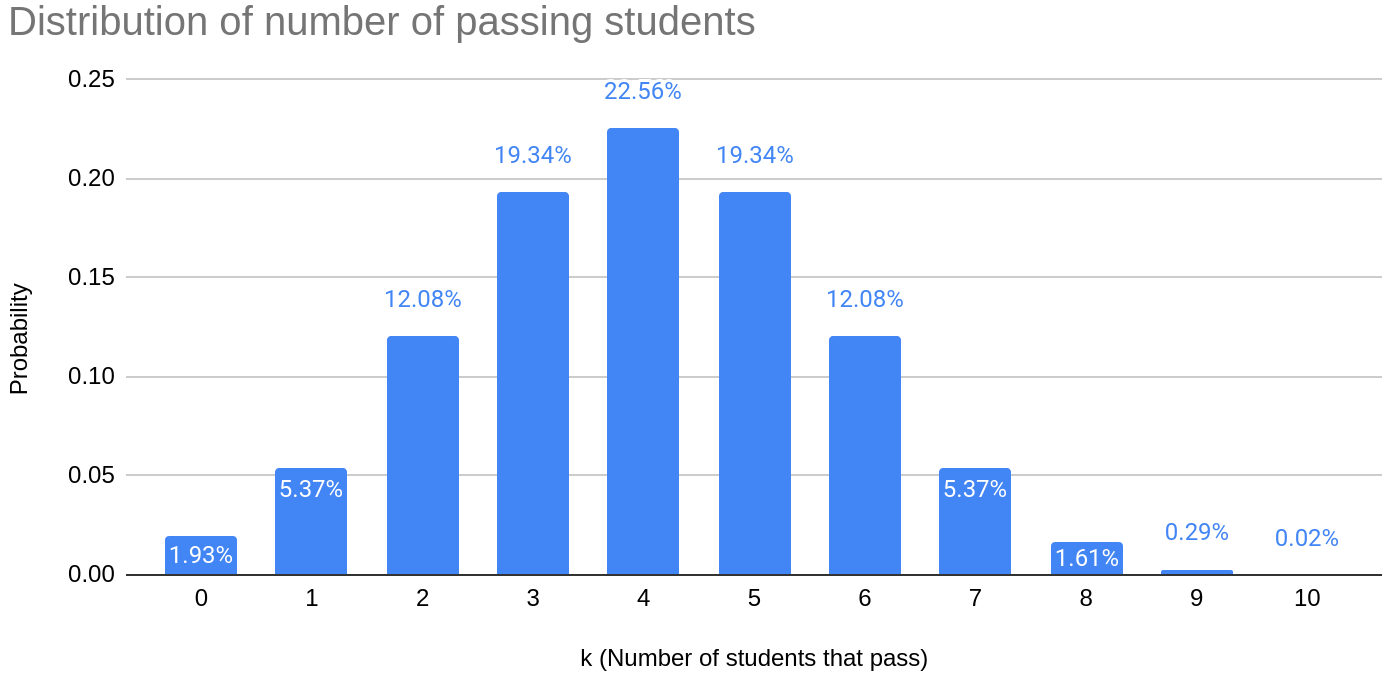
Suppose there are students and questions. What is the probability exactly students pass, for varying ?
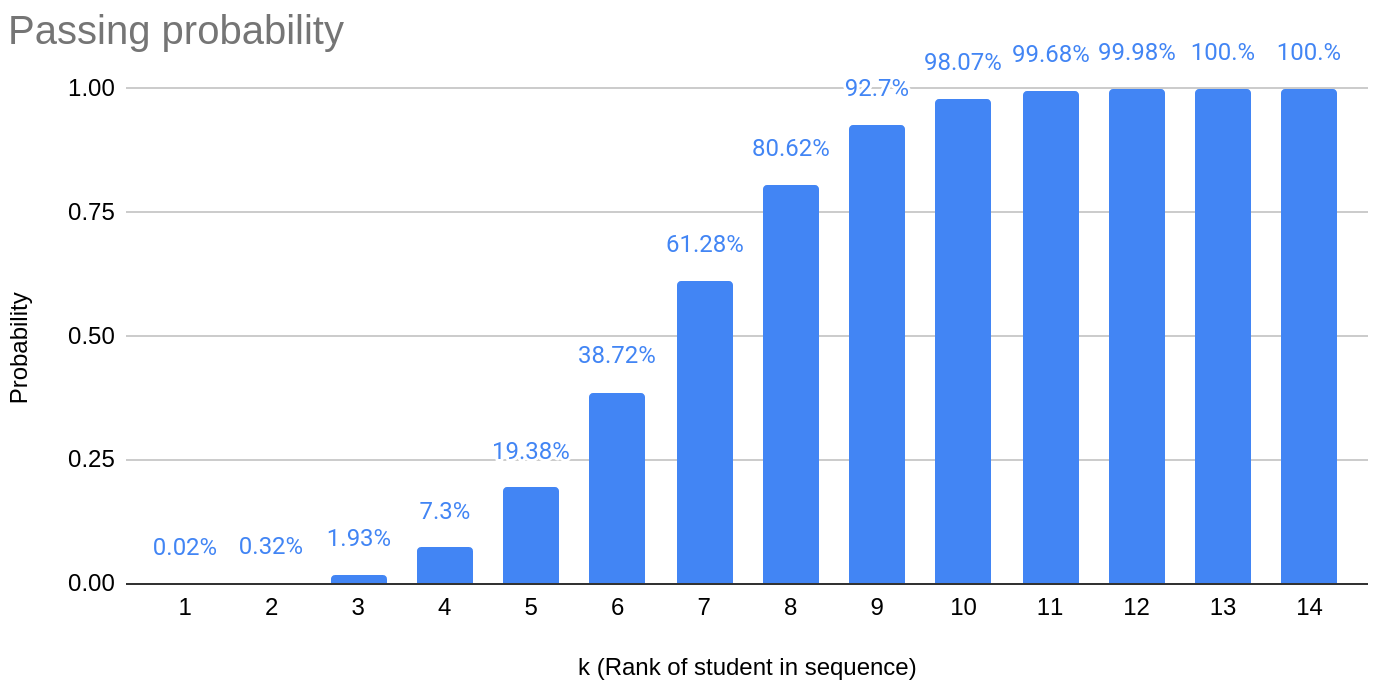
Suppose there are questions. What’s the probability that the th student passes, for varying ? This is basically plotting the CDF of the binomial distribution; as explained earlier, the probability is for .
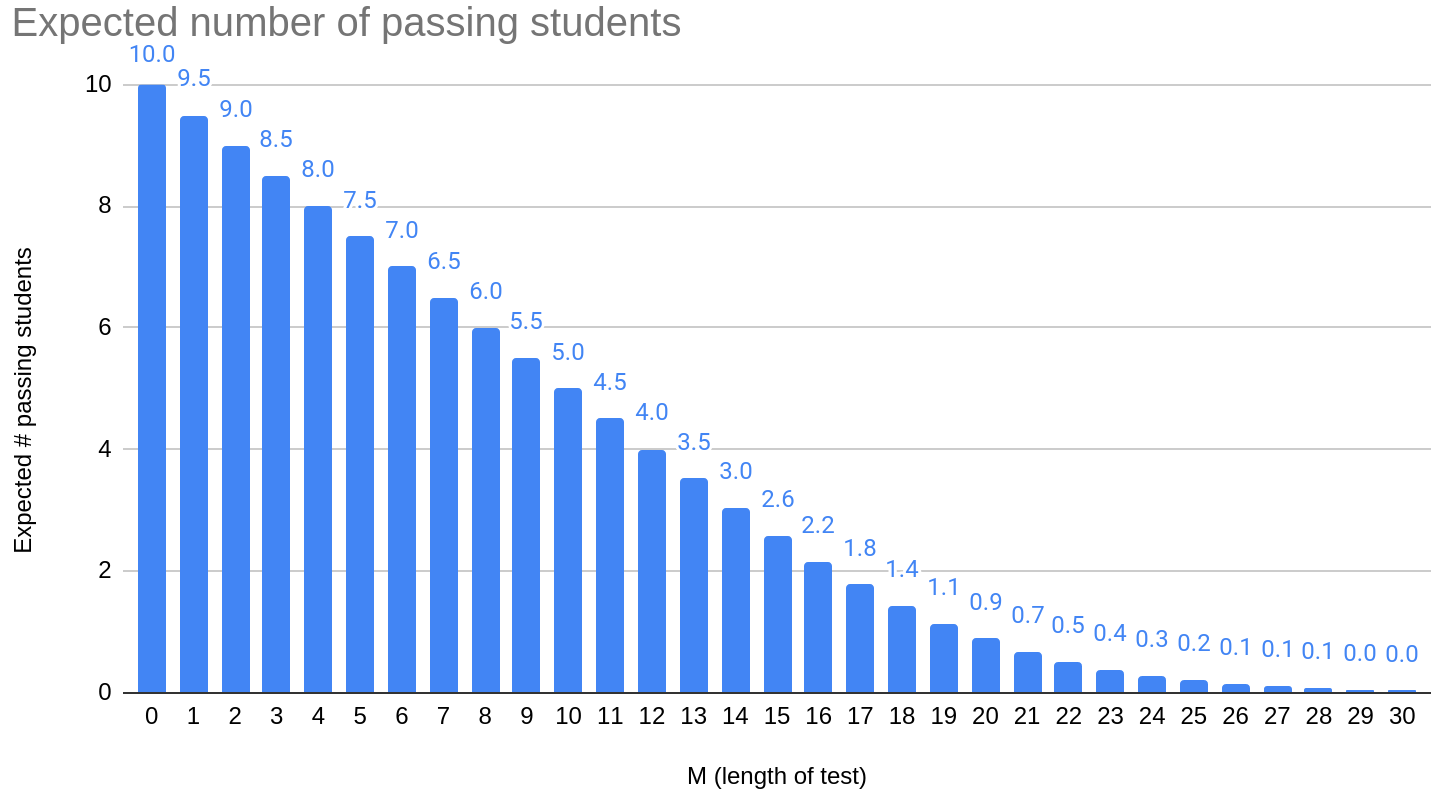
Suppose there are students. What’s the expected number of students that pass if there are questions, for varying ? Here we can see a linear decrease in expectation until ; from then on, we begin to hit the edge case of our recursion that results in a truncated binomial distribution. The expectation then gradually approaches as grows.